Topic: Models
Models
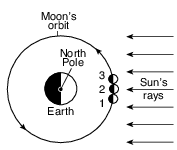
The photographs below show two celestial objects just before, during, and just after a total solar eclipse as viewed by an observer located in Kingston, Tennessee, on August 21, 2017.

Which diagram represents the location of the Moon in its orbit at the time that each of these three photographs (1, 2, and 3) were taken? (Diagrams are not drawn to scale.)
(1) 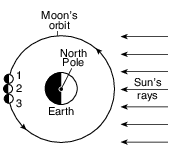
(2) 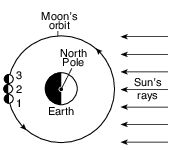
(3) 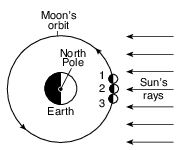
(4) 
The diagram below represents Earth in four positions, labeled A, B, C, and D, in its orbit around the Sun on the first day of each season.
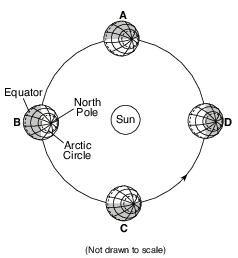
Between which two consecutive positions is the summer season occurring in the Northern Hemisphere?
(1) A and B
(2) B and C
(3) C and D
(4) D and A
The weather map below shows a storm centered north of Iceland. Points A, B, C, and D indicate locations on Earth’s surface. Isobars are labeled in millibars.
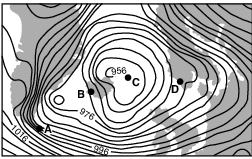
Which location was probably experiencing the highest wind speed?
(1) A
(2) B
(3) C
(4) D
The map below shows a cold, arctic air mass that moved southeast from Canada to cover most of the eastern half of the United States during January 2010.
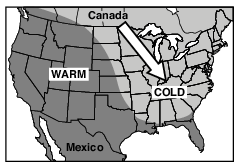
Which shift caused this flow of cold air out of Canada?
(1) the northward shift of the global temperature zones
(2) the northward shift of the Sun’s vertical rays
(3) a southward shift of the polar front jet stream
(4) a southward shift of the subtropical jet stream
Which conclusion can be drawn from the pattern of fossils found in Earth’s rock record?
(1) Humans have existed for a longer period of time than dinosaurs.
(2) Complex land organisms have been replaced by simpler marine forms.
(3) Many species have existed in the past, and most have become extinct.
(4) Few life forms existed before the late Cretaceous period.
The geologic cross section below represents a portion of Earth’s crust. The rock layers have not been overturned.
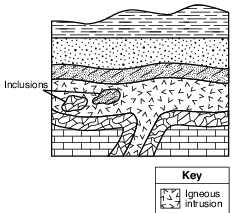
The inclusions were most likely broken off from their original rock layers
(1) at the same time as the intrusion of magma
(2) at the same time as the crystallization of magma
(3) before the formation of sandstone
(4) before the formation of limestone
While studying sediments deposited during and after the last ice age, scientists discovered that foraminiferid shells coil in different directions when they grow under different temperature conditions, as shown in the diagram below.

Foraminiferid shells found in layer X most likely coiled to the
(1) right, because water temperatures were cool
(2) right, because water temperatures were warm
(3) left, because water temperatures were cool
(4) left, because water temperatures were warm
Approximately how many million years ago (mya) was the amount of Earth’s total landmass located south of the equator the greatest?
(1) 119 mya
(2) 232 mya
(3) 359 mya
(4) 458 mya
The block diagram below represents the formation of an island arc near a plate boundary.

An island arc is located near the boundary between which two tectonic plates?
(1) Antarctic Plate and Indian–Australian Plate
(2) Philippine Plate and Eurasian Plate
(3) African Plate and North American Plate
(4) Scotia Plate and South American Plate
The photograph below shows a portion of the San Andreas Fault in the western United States.
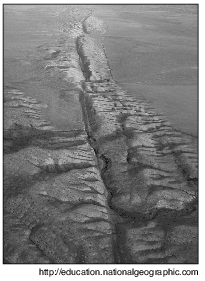
The San Andreas Fault is an example of a
(1) transform plate boundary
(2) divergent plate boundary
(3) convergent plate boundary
(4) complex plate boundary
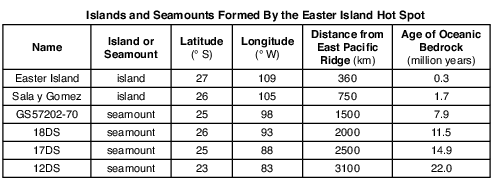
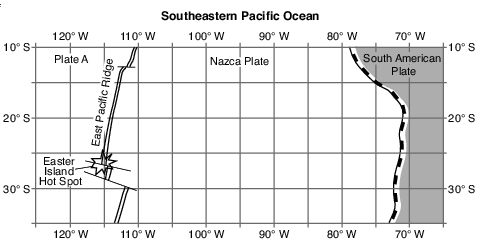
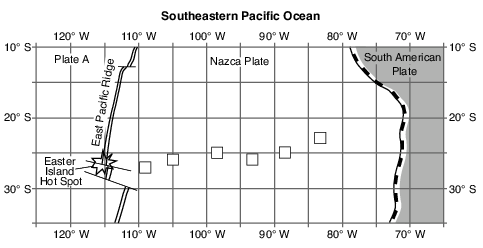
On the map in the image provided, plot with Xs the locations of the six islands and seamounts formed by the Easter Island Hot Spot. [1]
Allow 1 credit if the centers of all six Xs are within or touch the clear boxes shown below.. Note: Allow credit if a symbol other than an X is used.
• It is recommended that an overlay of the same scale as the student answer sheet be used to ensure reliability in rating.
• 
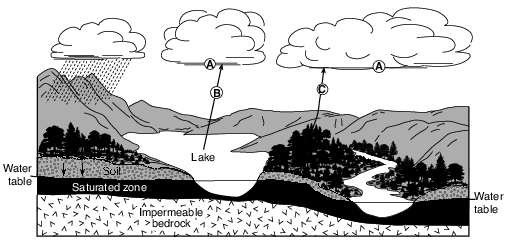
Water vapor forms a cloud of liquid droplets at location A. State the number of joules per gram of heat energy that is released into the atmosphere during this process. [1]
J/g
Allow 1 credit for 2260 J/g.
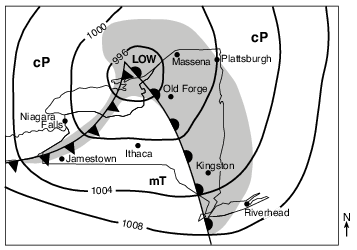
Identify the location labeled on the map that will next experience a short burst of heavy precipitation, a change in wind direction, and a rapid decrease in temperature. [1]
Allow 1 credit for Jamestown.
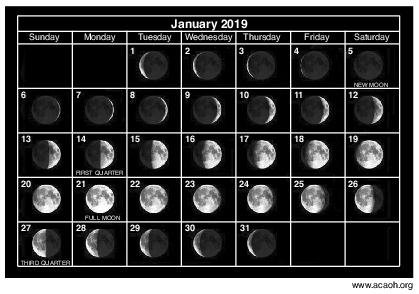
In image below, circle the position of the Moon in its orbit that produced the moon phase observed on January 17, 2019. [1]

Allow 1 credit for circling only the position shown in the example below.
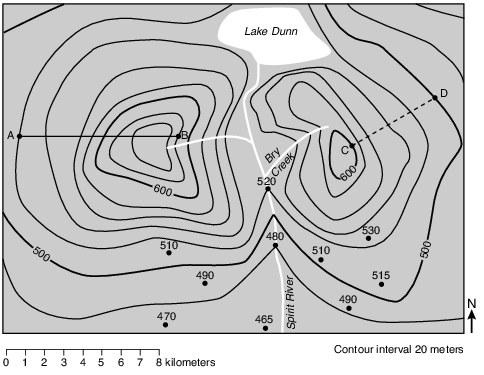
On the topographic map in the image provided, complete the 480-meter, 500-meter, and 520-meter contour lines on the southern portion of the map. [1]
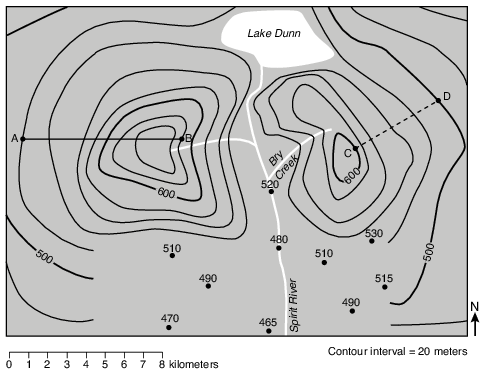
Allow 1 credit if all three contour lines are correctly drawn and connected to the partially drawn contour lines on either side of Spirit River.
• Note: If additional contour lines are drawn, all must be correct to receive credit.
• Do not allow credit if student-drawn contour lines do not pass through or touch the 480 m or 520 m dots.
• Example of a 1-credit response:
•